pyinstrument - Man Page
pyinstrument 4.6.2
Pyinstrument
[image: Screenshot] [image]
<https://raw.githubusercontent.com/joerick/pyinstrument/main/docs/img/screenshot.jpg>
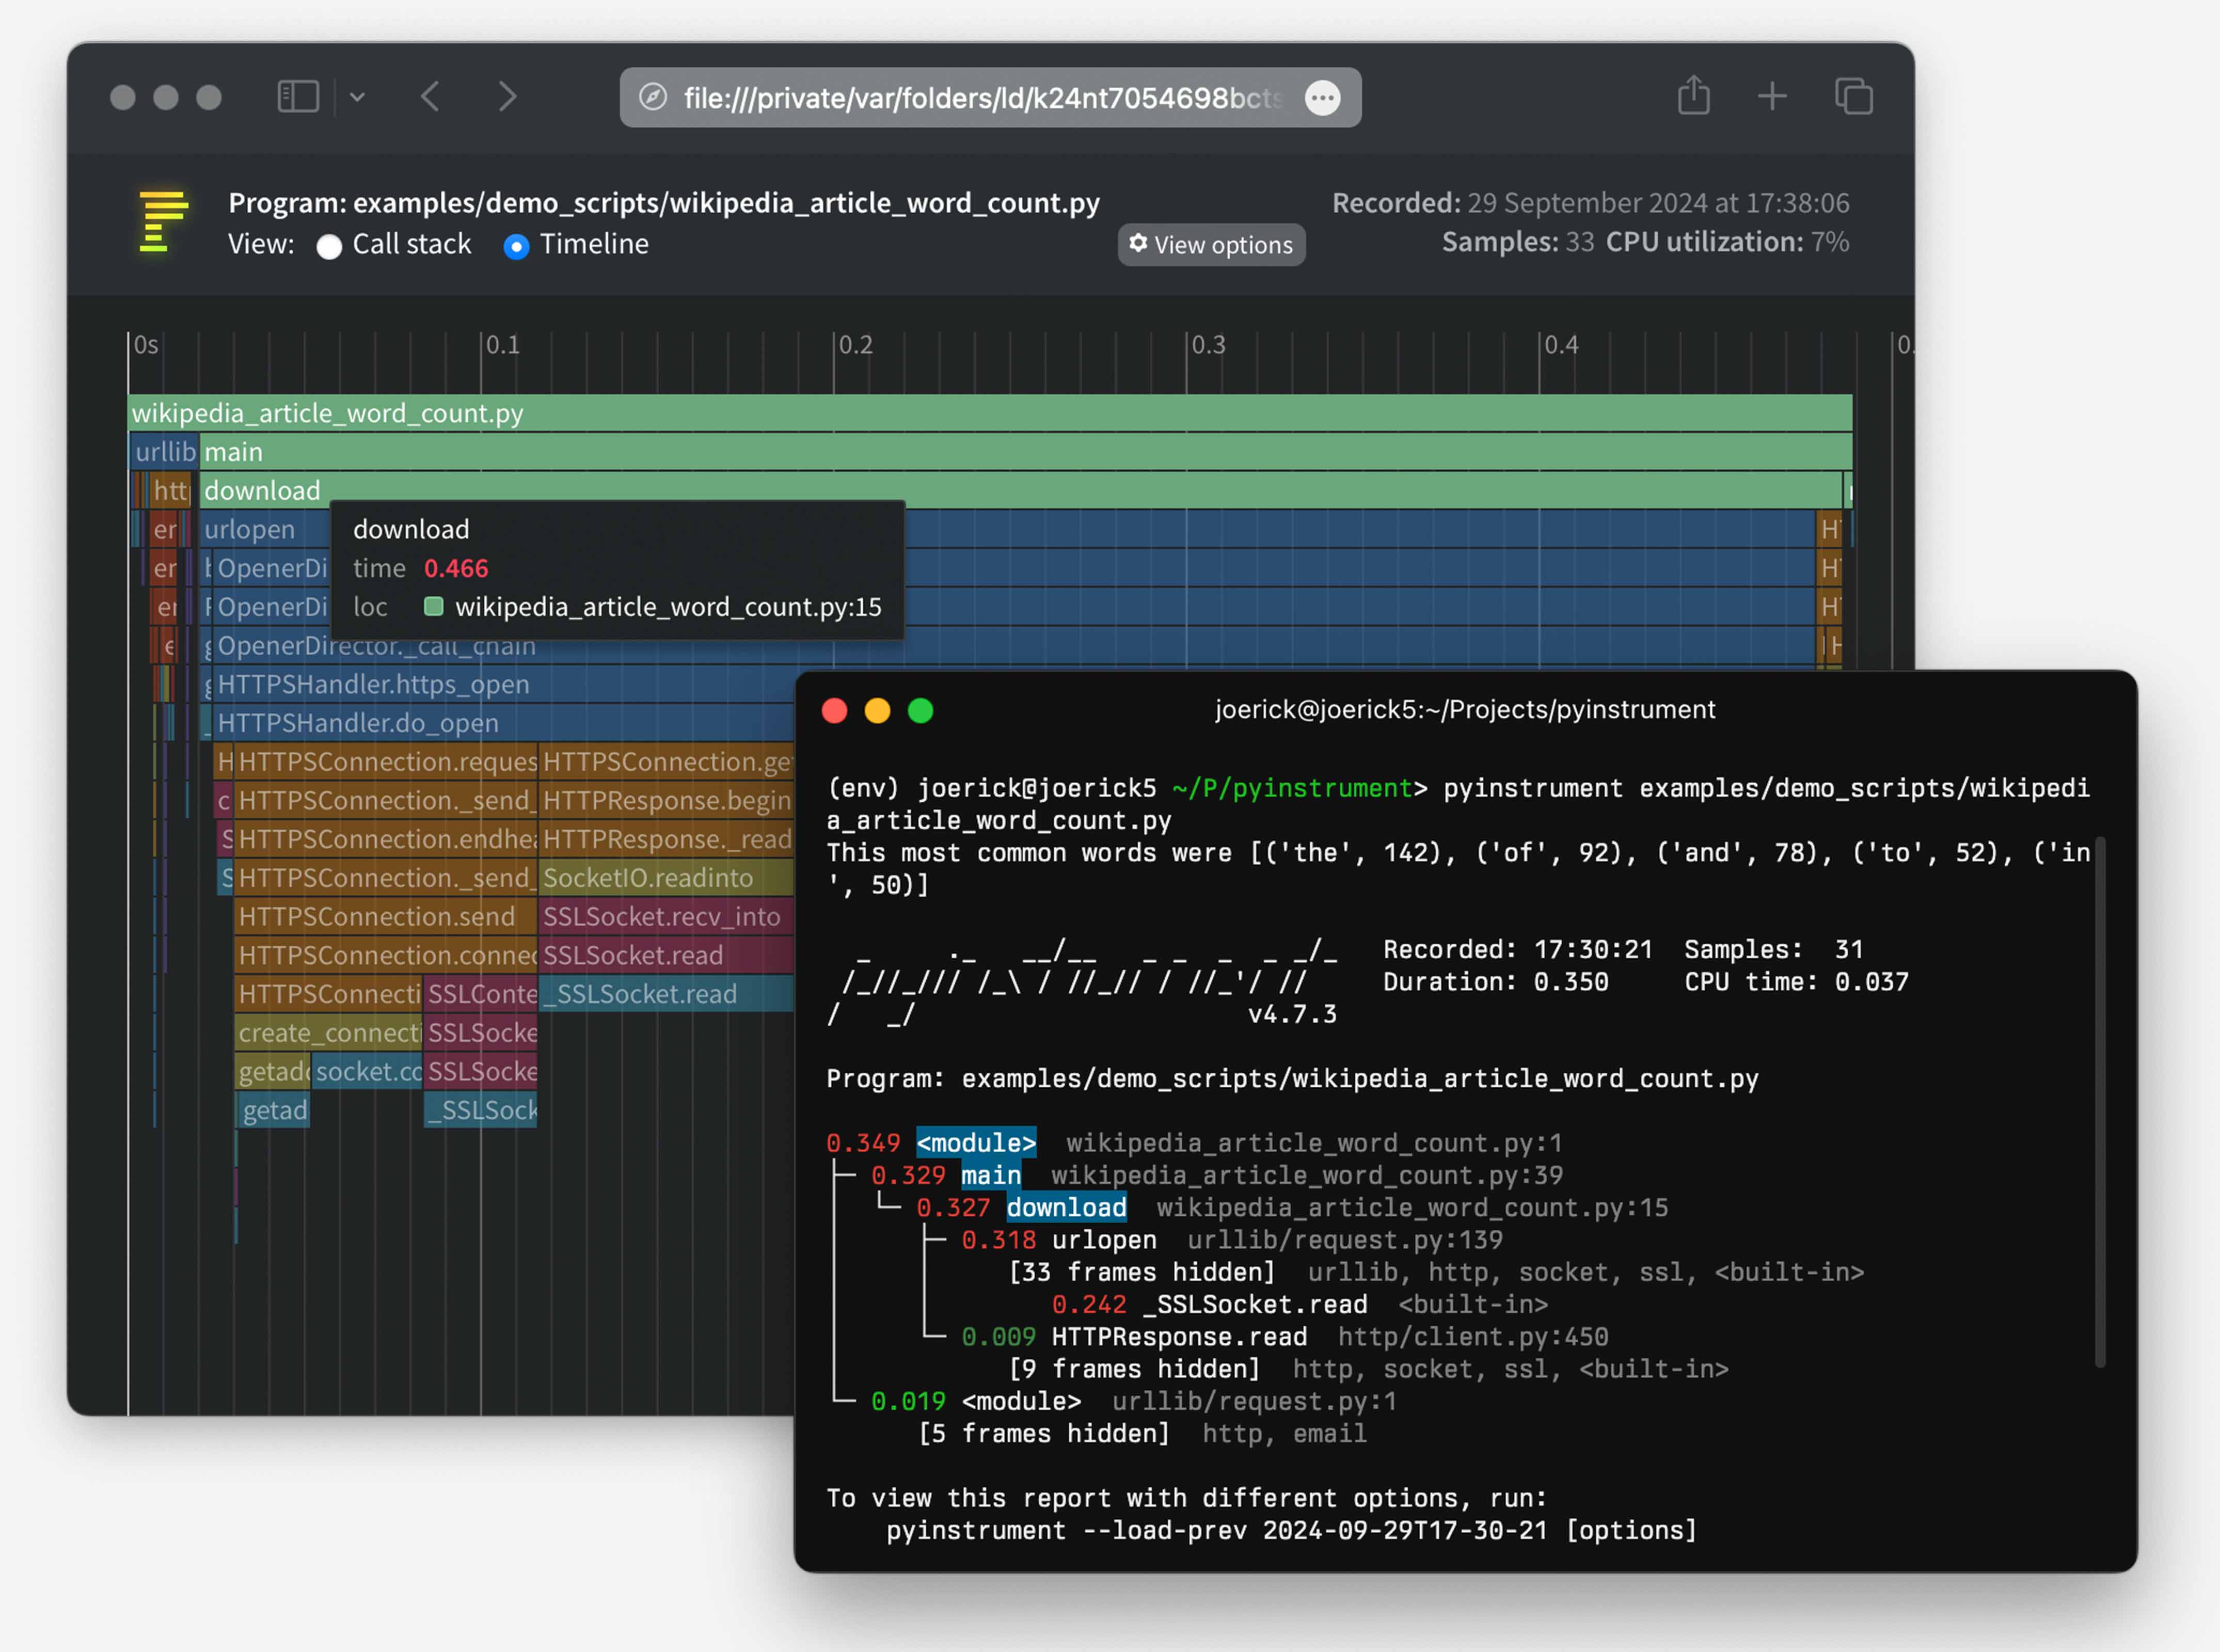
Pyinstrument is a Python profiler. A profiler is a tool to help you optimize your code - make it faster. To get the biggest speed increase you should focus on the slowest part of your program <https://en.wikipedia.org/wiki/Amdahl%27s_law>. Pyinstrument helps you find it!
☕️ Not sure where to start? Check out this video tutorial from calmcode.io <https://calmcode.io/pyinstrument/introduction.html>!
User Guide
Installation
pip install pyinstrument
Pyinstrument supports Python 3.7+.
Profile a Python script
Call Pyinstrument directly from the command line. Instead of writing python script.py, type pyinstrument script.py. Your script will run as normal, and at the end (or when you press ^C), Pyinstrument will output a colored summary showing where most of the time was spent.
Here are the options you can use:
Usage: pyinstrument [options] scriptfile [arg] ...

Options:
  --version             show program's version number and exit
  -h, --help            show this help message and exit
  --load-prev=ID        instead of running a script, load a previous report
  -m MODULE_NAME        run library module as a script, like 'python -m
                        module'
  --from-path           (POSIX only) instead of the working directory, look
                        for scriptfile in the PATH environment variable
  -o OUTFILE, --outfile=OUTFILE
                        save to <outfile>
  -r RENDERER, --renderer=RENDERER
                        how the report should be rendered. One of: 'text',
                        'html', 'json', 'speedscope', or python import path
                        to a renderer class
  -t, --timeline        render as a timeline - preserve ordering and don't
                        condense repeated calls
  --hide=EXPR           glob-style pattern matching the file paths whose
                        frames to hide. Defaults to '*/lib/*'.
  --hide-regex=REGEX    regex matching the file paths whose frames to hide.
                        Useful if --hide doesn't give enough control.
  --show=EXPR           glob-style pattern matching the file paths whose
                        frames to show, regardless of --hide or --hide-regex.
                        For example, use --show '*/<library>/*' to show frames
                        within a library that would otherwise be hidden.
  --show-regex=REGEX    regex matching the file paths whose frames to always
                        show. Useful if --show doesn't give enough control.
  --show-all            show everything
  --unicode             (text renderer only) force unicode text output
  --no-unicode          (text renderer only) force ascii text output
  --color               (text renderer only) force ansi color text output
  --no-color            (text renderer only) force no color text output
Protip: -r html will give you a interactive profile report as HTML - you can really explore this way!
Profile a Python CLI command
For profiling an installed Python script via the "console_script" entry point <https://packaging.python.org/en/latest/specifications/entry-points/#use-for-scripts>, call Pyinstrument directly from the command line with the --from-path flag. Instead of writing cli-script, type pyinstrument --from-path cli-script. Your script will run as normal, and at the end (or when you press ^C), Pyinstrument will output a colored summary showing where most of the time was spent.
Profile a specific chunk of code
Pyinstrument also has a Python API. Just surround your code with Pyinstrument, like this:
from pyinstrument import Profiler

profiler = Profiler()
profiler.start()

# code you want to profile

profiler.stop()

profiler.print()
If you get "No samples were recorded." because your code executed in under 1ms, hooray! If you still want to instrument the code, set an interval value smaller than the default 0.001 (1 millisecond) like this:
profiler = Profiler(interval=0.0001)
...
Experiment with the interval value to see different depths, but keep in mind that smaller intervals could affect the performance overhead of profiling.
Protip: To explore the profile in a web browser, use profiler.open_in_browser() <#pyinstrument.Profiler.open_in_browser>. To save this HTML for later, use profiler.output_html() <#pyinstrument.Profiler.output_html>.
Profile code in Jupyter/IPython
Via IPython magics <https://ipython.readthedocs.io/en/stable/interactive/magics.html>, you can profile a line or a cell in IPython or Jupyter.
Example:
%load_ext pyinstrument
%%pyinstrument
import time

def a():
    b()
    c()
def b():
    d()
def c():
    d()
def d():
    e()
def e():
    time.sleep(1)
a()
To customize options, see %%pyinstrument??.
Profile a web request in Django
To profile Django web requests, add pyinstrument.middleware.ProfilerMiddleware to MIDDLEWARE in your settings.py.
Once installed, add ?profile to the end of a request URL to activate the profiler. Your request will run as normal, but instead of getting the response, you'll get pyinstrument's analysis of the request in a web page.
If you're writing an API, it's not easy to change the URL when you want to profile something. In this case, add PYINSTRUMENT_PROFILE_DIR = 'profiles' to your settings.py. Pyinstrument will profile every request and save the HTML output to the folder profiles in your working directory.
If you want to show the profiling page depending on the request you can define PYINSTRUMENT_SHOW_CALLBACK as dotted path to a function used for determining whether the page should show or not. You can provide your own function callback(request) which returns True or False in your settings.py.
def custom_show_pyinstrument(request):
    return request.user.is_superuser


PYINSTRUMENT_SHOW_CALLBACK = "%s.custom_show_pyinstrument" % __name__
You can configure the profile output type using setting's variable PYINSTRUMENT_PROFILE_DIR_RENDERER. Default value is pyinstrument.renderers.HTMLRenderer. The supported renderers are pyinstrument.renderers.JSONRenderer, pyinstrument.renderers.HTMLRenderer, pyinstrument.renderers.SpeedscopeRenderer.
Profile a web request in Flask
A simple setup to profile a Flask application is the following:
from flask import Flask, g, make_response, request
app = Flask(__name__)

@app.before_request
def before_request():
    if "profile" in request.args:
        g.profiler = Profiler()
        g.profiler.start()


@app.after_request
def after_request(response):
    if not hasattr(g, "profiler"):
        return response
    g.profiler.stop()
    output_html = g.profiler.output_html()
    return make_response(output_html)
This will check for the ?profile query param on each request and if found, it starts profiling. After each request where the profiler was running it creates the html output and returns that instead of the actual response.
Profile a web request in FastAPI
To profile call stacks in FastAPI, you can write a middleware extension for pyinstrument.
Create an async function and decorate with app.middleware('http') where app is the name of your FastAPI application instance.
Make sure you configure a setting to only make this available when required.
from pyinstrument import Profiler


PROFILING = True  # Set this from a settings model

if PROFILING:
    @app.middleware("http")
    async def profile_request(request: Request, call_next):
        profiling = request.query_params.get("profile", False)
        if profiling:
            profiler = Profiler(interval=settings.profiling_interval, async_mode="enabled")
            profiler.start()
            await call_next(request)
            profiler.stop()
            return HTMLResponse(profiler.output_html())
        else:
            return await call_next(request)
To invoke, make any request to your application with the GET parameter profile=1 and it will print the HTML result from pyinstrument.
Profile a web request in Falcon
For profile call stacks in Falcon, you can write a middleware extension using pyinstrument.
Create a middleware class and start the profiler at process_request and stop it at process_response. The middleware can be added to the app.
Make sure you configure a setting to only make this available when required.
from pyinstrument import Profiler
import falcon

class ProfilerMiddleware:
    def __init__(self, interval=0.01):
        self.profiler = Profiler(interval=interval)

    def process_request(self, req, resp):
        self.profiler.start()

    def process_response(self, req, resp, resource, req_succeeded):
        self.profiler.stop()
        self.profiler.open_in_browser()

PROFILING = True  # Set this from a settings model

app = falcon.App()
if PROFILING:
    app.add_middleware(ProfilerMiddleware())
To invoke, make any request to your application and it launch a new window printing the HTML result from pyinstrument.
Profile Pytest tests
Pyinstrument can be invoked via the command-line to run pytest, giving you a consolidated report for the test suite.
pyinstrument -m pytest [pytest-args...]
Or, to instrument specific tests, create and auto-use fixture in conftest.py in your test folder:
from pathlib import Path
import pytest
from pyinstrument import Profiler

TESTS_ROOT = Path.cwd()

@pytest.fixture(autouse=True)
def auto_profile(request):
    PROFILE_ROOT = (TESTS_ROOT / ".profiles")
    # Turn profiling on
    profiler = Profiler()
    profiler.start()

    yield  # Run test

    profiler.stop()
    PROFILE_ROOT.mkdir(exist_ok=True)
    results_file = PROFILE_ROOT / f"{request.node.name}.html"
    profiler.write_html(results_file)
This will generate a HTML file for each test node in your test suite inside the .profiles directory.
Profile something else?
I'd love to have more ways to profile using Pyinstrument - e.g. other web frameworks. PRs are encouraged!
How It Works
Pyinstrument interrupts the program every 1ms[1] and records the entire stack at that point. It does this using a C extension and PyEval_SetProfile, but only taking readings every 1ms. Check out this blog post <http://joerick.me/posts/2017/12/15/pyinstrument-20/> for more info.
You might be surprised at how few samples make up a report, but don't worry, it won't decrease accuracy. The default interval of 1ms is a lower bound for recording a stackframe, but if there is a long time spent in a single function call, it will be recorded at the end of that call. So effectively those samples were 'bunched up' and recorded at the end.
Statistical profiling (not tracing)
Pyinstrument is a statistical profiler - it doesn't track every function call that your program makes. Instead, it's recording the call stack every 1ms.
That gives some advantages over other profilers. Firstly, statistical profilers are much lower-overhead than tracing profilers.
| Django template render × 4000 | Overhead | |
| Base | ████████████████ 0.33s | |
| pyinstrument | ████████████████████ 0.43s | 30% |
| cProfile | █████████████████████████████ 0.61s | 84% |
| profile | ██████████████████████████████████...██ 6.79s | 2057% |
But low overhead is also important because it can distort the results. When using a tracing profiler, code that makes a lot of Python function calls invokes the profiler a lot, making it slower. This distorts the results, and might lead you to optimise the wrong part of your program!
Full-stack recording
The standard Python profilers profile <http://docs.python.org/2/library/profile.html#module-profile> and cProfile <http://docs.python.org/2/library/profile.html#module-cProfile> show you a big list of functions, ordered by the time spent in each function. This is great, but it can be difficult to interpret why those functions are getting called. It's more helpful to know why those functions are called, and which parts of user code were involved.
For example, let's say I want to figure out why a web request in Django is slow. If I use cProfile, I might get this:
151940 function calls (147672 primitive calls) in 1.696 seconds

   Ordered by: cumulative time

   ncalls  tottime  percall  cumtime  percall filename:lineno(function)
        1    0.000    0.000    1.696    1.696 profile:0(<code object <module> at 0x1053d6a30, file "./manage.py", line 2>)
        1    0.001    0.001    1.693    1.693 manage.py:2(<module>)
        1    0.000    0.000    1.586    1.586 __init__.py:394(execute_from_command_line)
        1    0.000    0.000    1.586    1.586 __init__.py:350(execute)
        1    0.000    0.000    1.142    1.142 __init__.py:254(fetch_command)
       43    0.013    0.000    1.124    0.026 __init__.py:1(<module>)
      388    0.008    0.000    1.062    0.003 re.py:226(_compile)
      158    0.005    0.000    1.048    0.007 sre_compile.py:496(compile)
        1    0.001    0.001    1.042    1.042 __init__.py:78(get_commands)
      153    0.001    0.000    1.036    0.007 re.py:188(compile)
  106/102    0.001    0.000    1.030    0.010 __init__.py:52(__getattr__)
        1    0.000    0.000    1.029    1.029 __init__.py:31(_setup)
        1    0.000    0.000    1.021    1.021 __init__.py:57(_configure_logging)
        2    0.002    0.001    1.011    0.505 log.py:1(<module>)
It's often hard to understand how your own code relates to these traces.
Pyinstrument records the entire stack, so tracking expensive calls is much easier. It also hides library frames by default, letting you focus on your app/module is affecting performance.
  _     ._   __/__   _ _  _  _ _/_   Recorded: 14:53:35  Samples:  131
 /_//_/// /_\ / //_// / //_'/ //    Duration: 3.131     CPU time: 0.195
/   _/                    v3.0.0b3

Program: examples/django_example/manage.py runserver --nothreading --noreload

3.131 <module>  manage.py:2
└─ 3.118 execute_from_command_line  django/core/management/__init__.py:378
      [473 frames hidden]  django, socketserver, selectors, wsgi...
         2.836 select  selectors.py:365
         0.126 _get_response  django/core/handlers/base.py:96
         └─ 0.126 hello_world  django_example/views.py:4
'Wall-clock' time (not CPU time)
Pyinstrument records duration using 'wall-clock' time. When you're writing a program that downloads data, reads files, and talks to databases, all that time is included in the tracked time by pyinstrument.
That's really important when debugging performance problems, since Python is often used as a 'glue' language between other services. The problem might not be in your program, but you should still be able to find why it's slow.
Async profiling
pyinstrument can profile async programs that use async and await. This async support works by tracking the 'context' of execution, as provided by the built-in contextvars <https://docs.python.org/3/library/contextvars.html> module.
When you start a Profiler with the async_mode <#pyinstrument.Profiler.async_mode> enabled or strict (not disabled), that Profiler is attached to the current async context.
When profiling, pyinstrument keeps an eye on the context. When execution exits the context, it captures the await stack that caused the context to exit. Any time spent outside the context is attributed to the that halted execution of the await.
Async contexts are inherited, so tasks started when a profiler is active are also profiled.
[image: Async context inheritance] [image]
pyinstrument supports async mode with Asyncio and Trio, other async/await frameworks should work as long as they use contextvars <https://docs.python.org/3/library/contextvars.html>.
Greenlet <https://pypi.org/project/greenlet/> doesn't use async and await, and alters the Python stack during execution, so is not fully supported. However, because greenlet also supports contextvars <https://docs.python.org/3/library/contextvars.html>, we can limit profiling to one green thread, using strict mode. In strict mode, whenever your green thread is halted the time will be tracked in an <out-of-context> frame. Alternatively, if you want to see what's happening when your green thread is halted, you can use async_mode='disabled' - just be aware that readouts might be misleading if multiple tasks are running concurrently.
----
- [1]
Or, your configured interval.
API Reference
Command line interface
pyinstrument works just like python, on the command line, so you can call your scripts like pyinstrument script.py or pyinstrument -m my_module.
When your script ends, or when you kill it with ctrl-c, pyinstrument will print a profile report to the console.
- System Message: ERROR/6 (/builddir/build/BUILD/pyinstrument-4.6.2-build/pyinstrument-4.6.2/docs/reference.md:, line 12)
Command ['pyinstrument', '--help'] failed: [Errno 2] No such file or directory: 'pyinstrument'
Python API
The Python API is also available, for calling pyinstrument directly from Python and writing integrations with with other tools.
The Profiler object
- class pyinstrument.Profiler(interval=0.001, async_mode='enabled')
The profiler - this is the main way to use pyinstrument.
Note the profiling will not start until start() is called.
- Parameters
- interval (float) -- See interval.
- async_mode (AsyncMode) -- See async_mode.
- property interval: float
The minimum time, in seconds, between each stack sample. This translates into the resolution of the sampling.
- property async_mode: str
Configures how this Profiler tracks time in a program that uses async/await.
- enabled
When this profiler sees an await, time is logged in the function that awaited, rather than observing other coroutines or the event loop.
- disabled
This profiler doesn't attempt to track await. In a program that uses async/await, this will interleave other coroutines and event loop machinery in the profile. Use this option if async support is causing issues in your use case, or if you want to run multiple profilers at once.
- strict
Instructs the profiler to only profile the current async context <https://docs.python.org/3/library/contextvars.html>. Frames that are observed in an other context are ignored, tracked instead as <out-of-context>.
- property last_session: Session <#pyinstrument.session.Session> | None
The previous session recorded by the Profiler.
- start(caller_frame=None)
Instructs the profiler to start - to begin observing the program's execution and recording frames.
The normal way to invoke start() is with a new instance, but you can restart a Profiler that was previously running, too. The sessions are combined.
- Parameters
caller_frame (FrameType | None) --
Set this to override the default behaviour of treating the caller of start() as the 'start_call_stack' - the instigator of the profile. Most renderers will trim the 'root' from the call stack up to this frame, to present a simpler output.
You might want to set this to inspect.currentframe().f_back if you are writing a library that wraps pyinstrument.
- stop()
Stops the profiler observing, and sets last_session to the captured session.
- Returns
The captured session.
- Return type
Session <#pyinstrument.session.Session>
- property is_running
Returns True if this profiler is running - i.e. observing the program execution.
- reset()
Resets the Profiler, clearing the last_session.
- __enter__()
Context manager support.
Profilers can be used in with blocks! See this example:
with Profiler() as p: # your code here... do_some_work() # profiling has ended. let's print the output. p.print()- print(file=sys.stdout, *, unicode=None, color=None, show_all=False, timeline=False)
Print the captured profile to the console.
- Parameters
- file (IO[str]) -- the IO stream to write to. Could be a file descriptor or sys.stdout, sys.stderr. Defaults to sys.stdout.
- unicode (bool | None) -- Override unicode support detection.
- color (bool | None) -- Override ANSI color support detection.
- show_all (bool) -- Sets the show_all parameter on the renderer.
- timeline (bool) -- Sets the timeline parameter on the renderer.
- output_text(unicode=False, color=False, show_all=False, timeline=False)
Return the profile output as text, as rendered by ConsoleRenderer
- output_html(timeline=False, show_all=False)
Return the profile output as HTML, as rendered by HTMLRenderer
- write_html(path, timeline=False, show_all=False)
Writes the profile output as HTML to a file, as rendered by HTMLRenderer
- open_in_browser(timeline=False)
Opens the last profile session in your web browser.
- output(renderer)
Returns the last profile session, as rendered by renderer.
- Parameters
renderer (Renderer) -- The renderer to use.
Sessions
- class pyinstrument.session.Session
Represents a profile session, contains the data collected during a profile session.
- static load(filename)
Load a previously saved session from disk.
- Parameters
filename (PathOrStr) -- The path to load from.
- Return type
Session <#pyinstrument.session.Session>
- save(filename)
Saves a Session object to disk, in a JSON format.
- Parameters
filename (PathOrStr) -- The path to save to. Using the .pyisession extension is recommended.
- static combine(session1, session2)
Combines two Session objects.
Sessions that are joined in this way probably shouldn't be interpreted as timelines, because the samples are simply concatenated. But aggregate views (the default) of this data will work.
- Return type
Session <#pyinstrument.session.Session>
- root_frame(trim_stem=True)
Parses the internal frame records and returns a tree of Frame objects. This object can be rendered using a Renderer object.
- Return type
A Frame object, or None if the session is empty.
Renderers
Renderers transform a tree of Frame objects into some form of output.
Rendering has two steps:
- First, the renderer will 'preprocess' the Frame tree, applying each processor in the processor property, in turn.
- The resulting tree is rendered into the desired format.
Therefore, rendering can be customised by changing the processors property. For example, you can disable time-aggregation (making the profile into a timeline) by removing aggregate_repeated_calls().
- class pyinstrument.renderers.FrameRenderer(show_all=False, timeline=False, processor_options=None)
An abstract base class for renderers that process Frame objects using processor functions. Provides a common interface to manipulate the processors before rendering.
- Parameters
- show_all (bool) -- Don't hide library frames - show everything that pyinstrument captures.
- timeline (bool) -- Instead of aggregating time, leave the samples in chronological order.
- processor_options (dict[str, Any]) -- A dictionary of processor options.
- processors: List[Callable[[...], Frame | None]]
Processors installed on this renderer. This property is defined on the base class to provide a common way for users to add and manipulate them before calling render().
- processor_options: dict[str, Any]
Dictionary containing processor options, passed to each processor.
- default_processors()
Return a list of processors that this renderer uses by default.
- render(session)
Return a string that contains the rendered form of frame.
- class pyinstrument.renderers.ConsoleRenderer(unicode=False, color=False, flat=False, time='seconds', **kwargs)
Produces text-based output, suitable for text files or ANSI-compatible consoles.
- Parameters
- unicode (bool) -- Use unicode, like box-drawing characters in the output.
- color (bool) -- Enable color support, using ANSI color sequences.
- flat (bool) -- Display a flat profile instead of a call graph.
- time (LiteralStr['seconds', 'percent_of_total']) -- How to display the duration of each frame - 'seconds' or 'percent_of_total'
- class pyinstrument.renderers.HTMLRenderer(**kwargs)
Renders a rich, interactive web page, as a string of HTML.
- Parameters
- show_all -- Don't hide library frames - show everything that pyinstrument captures.
- timeline -- Instead of aggregating time, leave the samples in chronological order.
- processor_options -- A dictionary of processor options.
- class pyinstrument.renderers.JSONRenderer(**kwargs)
Outputs a tree of JSON, containing processed frames.
- Parameters
- show_all -- Don't hide library frames - show everything that pyinstrument captures.
- timeline -- Instead of aggregating time, leave the samples in chronological order.
- processor_options -- A dictionary of processor options.
- class pyinstrument.renderers.SpeedscopeRenderer(**kwargs)
Outputs a tree of JSON conforming to the speedscope schema documented at
wiki: <https://github.com/jlfwong/speedscope/wiki/Importing-from-custom-sources> schema: <https://www.speedscope.app/file-format-schema.json> spec: <https://github.com/jlfwong/speedscope/blob/main/src/lib/file-format-spec.ts> example: <https://github.com/jlfwong/speedscope/blob/main/sample/profiles/speedscope/0.0.1/simple.speedscope.json>
- Parameters
- show_all -- Don't hide library frames - show everything that pyinstrument captures.
- timeline -- Instead of aggregating time, leave the samples in chronological order.
- processor_options -- A dictionary of processor options.
Processors
Processors are functions that take a Frame object, and mutate the tree to perform some task.
They can mutate the tree in-place, but also can change the root frame, they should always be called like:
frame = processor(frame, options=...)
- pyinstrument.processors.remove_importlib(frame, options)
Removes <frozen importlib._bootstrap frames that clutter the output.
- pyinstrument.processors.remove_tracebackhide(frame, options)
Removes frames that have set a local __tracebackhide__ (e.g. __tracebackhide__ = True), to hide them from the output.
- pyinstrument.processors.aggregate_repeated_calls(frame, options)
Converts a timeline into a time-aggregate summary.
Adds together calls along the same call stack, so that repeated calls appear as the same frame. Removes time-linearity - frames are sorted according to total time spent.
Useful for outputs that display a summary of execution (e.g. text and html outputs)
- pyinstrument.processors.group_library_frames_processor(frame, options)
Groups frames that should be hidden into FrameGroup objects, according to hide_regex and show_regex in the options dict, as applied to the file path of the source code of the frame. If both match, 'show' has precedence. Options:
- hide_regex
regular expression, which if matches the file path, hides the frame in a frame group.
- show_regex
regular expression, which if matches the file path, ensures the frame is not hidden
Single frames are not grouped, there must be at least two frames in a group.
- pyinstrument.processors.merge_consecutive_self_time(frame, options, recursive=True)
Combines consecutive 'self time' frames.
- pyinstrument.processors.remove_unnecessary_self_time_nodes(frame, options)
When a frame has only one child, and that is a self-time frame, remove that node and move the time to parent, since it's unnecessary - it clutters the output and offers no additional information.
- pyinstrument.processors.remove_irrelevant_nodes(frame, options, total_time=None)
Remove nodes that represent less than e.g. 1% of the output. Options:
- filter_threshold
sets the minimum duration of a frame to be included in the output. Default: 0.01.
- pyinstrument.processors.remove_first_pyinstrument_frames_processor(frame, options)
The first few frames when using the command line are the __main__ of pyinstrument, the eval, and the 'runpy' module. I want to remove that from the output.
Internals notes
Frames are recorded by the Profiler in a time-linear fashion. While profiling, the profiler builds a list of frame stacks, with the frames having in format:
function_name <null> filename <null> function_line_number
When profiling is complete, this list is turned into a tree structure of Frame objects. This tree contains all the information as gathered by the profiler, suitable for a flame render.
Frame objects, the call tree, and processors
The frames are assembled to a call tree by the profiler session. The time-linearity is retained at this stage.
Before rendering, the call tree is then fed through a sequence of 'processors' to transform the tree for output.
The most interesting is aggregate_repeated_calls, which combines different instances of function calls into the same frame. This is intuitive as a summary of where time was spent during execution.
The rest of the processors focus on removing or hiding irrelevant Frames from the output.
Self time frames vs. frame.self_time
Self time nodes exist to record time spent in a node, but not in its children. But normal frame objects can have self_time too. Why? frame.self_time is used to store the self_time of any nodes that were removed during processing.
Indices and Tables
- Index <>
- Search Page <>
Author
Joe Rickerby
Copyright
2021, Joe Rickerby