fiologparser_hist.py - Man Page
Calculate statistics from fio histograms
Synopsis
fiologparser_hist.py [options] [clat_hist_files]...
Description
fiologparser_hist.py is a utility for converting *_clat_hist* files generated by fio into a CSV of latency statistics including minimum, average, maximum latency, and selectable percentiles.
Examples
$ fiologparser_hist.py *_clat_hist*
end-time, samples, min, avg, median, 90%, 95%, 99%, max
1000, 15, 192, 1678.107, 1788.859, 1856.076, 1880.040, 1899.208, 1888.000
2000, 43, 152, 1642.368, 1714.099, 1816.659, 1845.552, 1888.131, 1888.000
4000, 39, 1152, 1546.962, 1545.785, 1627.192, 1640.019, 1691.204, 1744
...
Options
- --help
Print these options.
- --buff_size=int
Number of samples to buffer into numpy at a time. Default is 10,000. This can be adjusted to help performance.
- --max_latency=int
Number of seconds of data to process at a time. Defaults to 20 seconds, in order to handle the 17 second upper bound on latency in histograms reported by fio. This should be increased if fio has been run with a larger maximum latency. Lowering this when a lower maximum latency is known can improve performance. See Notes for more details.
- -i, --interval=int
Interval at which statistics are reported. Defaults to 1000 ms. This should be set a minimum of the value for log_hist_msec as given to fio.
- --noweight
Do not perform weighting of samples between output intervals. Default is False.
- -d, --divisor=int
Divide statistics by this value. Defaults to 1. Useful if you want to convert latencies from milliseconds to seconds (divisor=1000).
- --warn
Enables warning messages printed to stderr, useful for debugging.
- --group_nr=int
Set this to the value of FIO_IO_U_PLAT_GROUP_NR as defined in stat.h if fio has been recompiled. Defaults to 19, the current value used in fio. See Notes for more details.
- --percentiles=str
Pass desired list of comma or colon separated percentiles to print. The default is "90.0:95.0:99.0", but min, median(50%) and max percentiles are always printed
- --usbin
Use to indicate to parser that histogram bin latencies values are in microseconds. The default is to use nanoseconds, but histogram logs from fio versions <= 2.99 are in microseconds.
- --directions=str
By default, all directions (e.g read and write) histogram bins are combined producing one 'mixed' result. To produce independent directional results, pass some combination of ´rwtm´ characters with the --directions=rwtm option. A ´dir´ column is added indicating the result direction for a row.
Notes
end-times are calculated to be uniform increments of the --interval value given, regardless of when histogram samples are reported. Of note:
Intervals with no samples are omitted. In the example above this means "no statistics from 2 to 3 seconds" and "39 samples influenced the statistics of the interval from 3 to 4 seconds".
Intervals with a single sample will have the same value for all statistics
The number of samples is unweighted, corresponding to the total number of samples which have any effect whatsoever on the interval.
Min statistics are computed using value of the lower boundary of the first bin (in increasing bin order) with non-zero samples in it. Similarly for max, we take the upper boundary of the last bin with non-zero samples in it. This is semantically identical to taking the 0th and 100th percentiles with a 50% bin-width buffer (because percentiles are computed using mid-points of the bins). This enforces the following nice properties:
min <= 50th <= 90th <= 95th <= 99th <= max
min and max are strict lower and upper bounds on the actual min / max seen by fio (and reported in *_clat.* with averaging turned off).
Average statistics use a standard weighted arithmetic mean.
When --noweights option is false (the default) percentile statistics are computed using the weighted percentile method as described here: https://en.wikipedia.org/wiki/Percentile#Weighted_percentile. See weights() method for details on how weights are computed for individual samples. In process_interval() we further multiply by the height of each bin to get weighted histograms.
We convert files given on the command line, assumed to be fio histogram files, An individual histogram file can contain the histograms for multiple different r/w directions (notably when --rw=randrw). This is accounted for by tracking each r/w direction separately. In the statistics reported we ultimately merge *all* histograms (regardless of r/w direction).
The value of *_GROUP_NR in stat.h (and *_BITS) determines how many latency bins fio outputs when histogramming is enabled. Namely for the current default of GROUP_NR=19, we get 1,216 bins with a maximum latency of approximately 17 seconds. For certain applications this may not be sufficient. With GROUP_NR=24 we have 1,536 bins, giving us a maximum latency of 541 seconds (~ 9 minutes). If you expect your application to experience latencies greater than 17 seconds, you will need to recompile fio with a larger GROUP_NR, e.g. with:
sed -i.bak 's/^#define FIO_IO_U_PLAT_GROUP_NR 190#define FIO_IO_U_PLAT_GROUP_NR 24/g' stat.h
make fio
Quick reference table for the max latency corresponding to a sampling of values for GROUP_NR:
GROUP_NR | # bins | max latency bin value
19       | 1216   | 16.9 sec
20       | 1280   | 33.8 sec
21       | 1344   | 67.6 sec
22       | 1408   | 2  min, 15 sec
23       | 1472   | 4  min, 32 sec
24       | 1536   | 9  min, 4  sec
25       | 1600   | 18 min, 8  sec
26       | 1664   | 36 min, 16 sec
At present this program automatically detects the number of histogram bins in the log files, and adjusts the bin latency values accordingly. In particular if you use the --log_hist_coarseness parameter of fio, you get output files with a number of bins according to the following table (note that the first row is identical to the table above):
coarse \ GROUP_NR
        19     20    21     22     23     24     25     26
   -------------------------------------------------------
  0  [[ 1216,  1280,  1344,  1408,  1472,  1536,  1600,  1664],
  1   [  608,   640,   672,   704,   736,   768,   800,   832],
  2   [  304,   320,   336,   352,   368,   384,   400,   416],
  3   [  152,   160,   168,   176,   184,   192,   200,   208],
  4   [   76,    80,    84,    88,    92,    96,   100,   104],
  5   [   38,    40,    42,    44,    46,    48,    50,    52],
  6   [   19,    20,    21,    22,    23,    24,    25,    26],
  7   [  N/A,    10,   N/A,    11,   N/A,    12,   N/A,    13],
  8   [  N/A,     5,   N/A,   N/A,   N/A,     6,   N/A,   N/A]]
For other values of GROUP_NR and coarseness, this table can be computed like this:
bins = [1216,1280,1344,1408,1472,1536,1600,1664]
max_coarse = 8
fncn = lambda z: list(map(lambda x: z/2**x if z % 2**x == 0 else nan, range(max_coarse + 1)))
np.transpose(list(map(fncn, bins)))
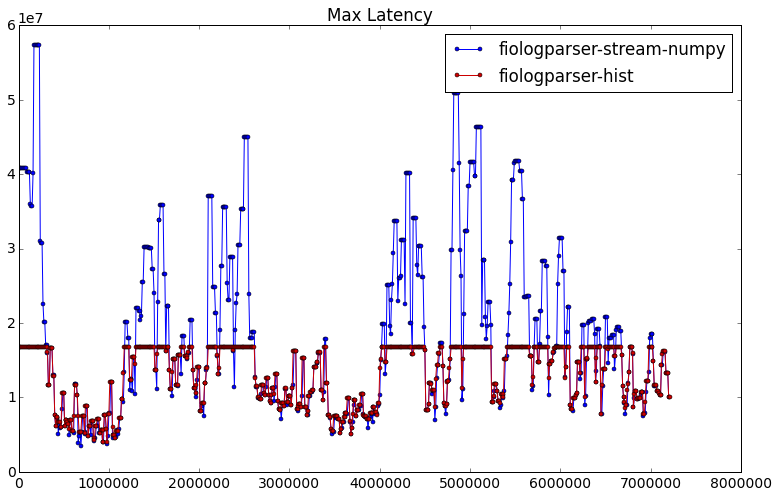
If you have not adjusted GROUP_NR for your (high latency) application, then you will see the percentiles computed by this tool max out at the max latency bin value as in the first table above, and in this plot (where GROUP_NR=19 and thus we see a max latency of ~16.7 seconds in the red line):
Motivation for, design decisions, and the implementation process are described in further detail here:
Author
fiologparser_hist.py and this manual page were written by Karl Cronburg <karl.cronburg@gmail.com>.
Reporting Bugs
Report bugs to the fio mailing list <fio@vger.kernel.org>.